Back on the bike, with a goal
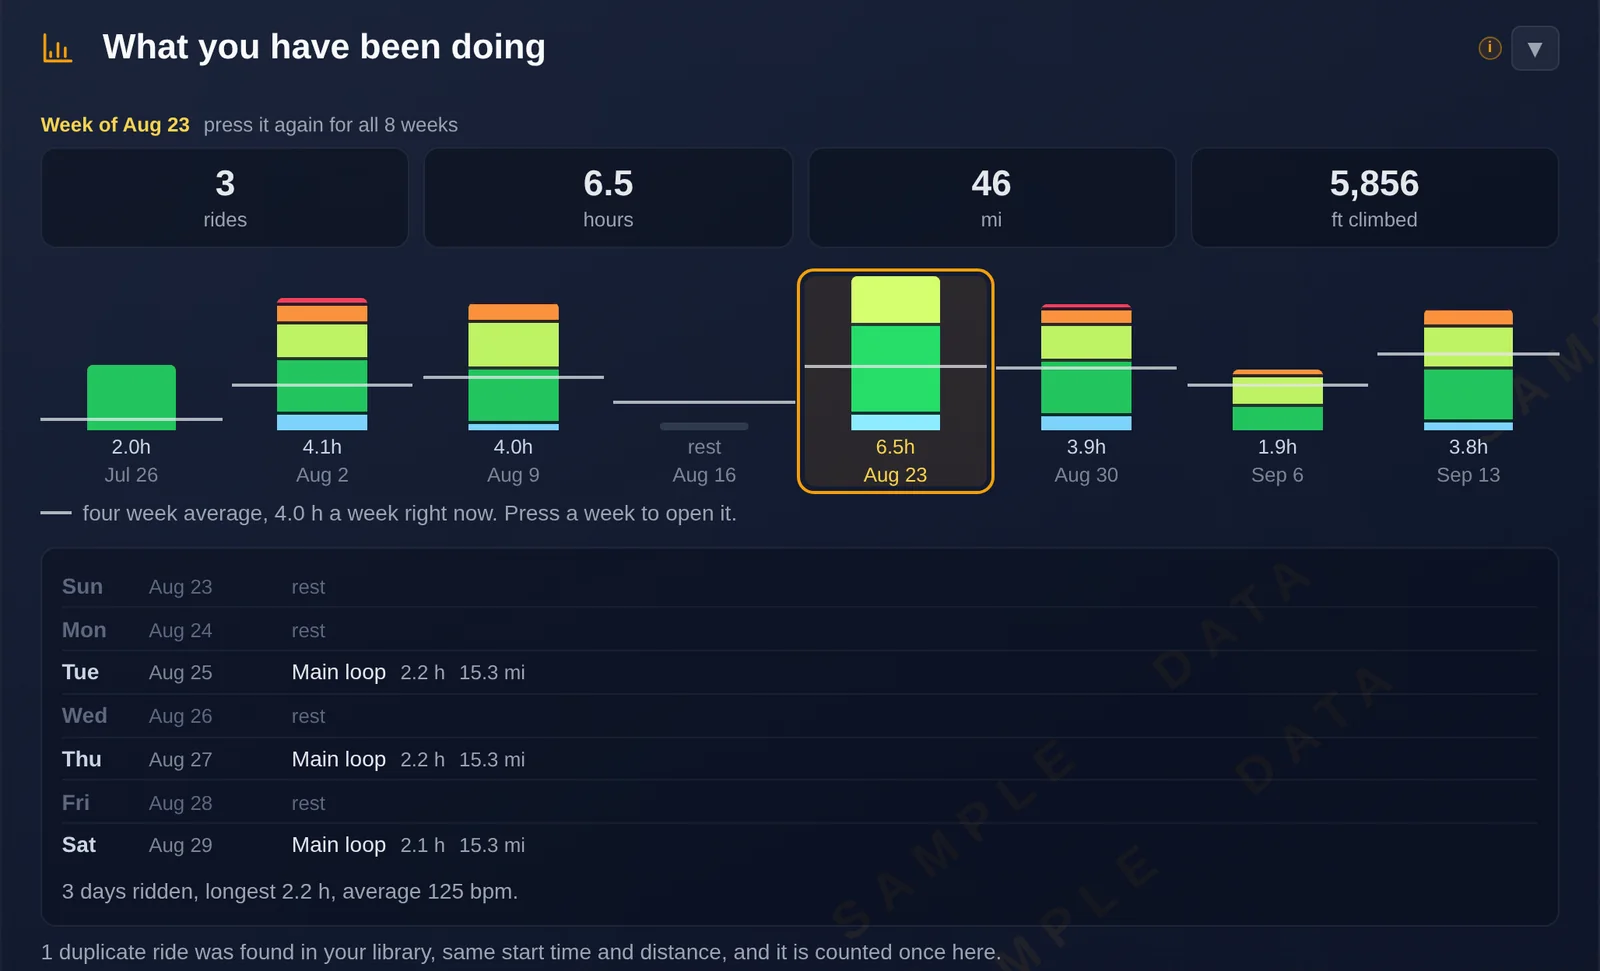
You picked a goal to get fit for, maybe the first in years. See how far off that day you are right now, what kind of riding closes the distance, and watch the gap shrink week by week on your own activities.
Mountain bike ride & race planning
Every rider fades differently. Redline Athlete simulates your efforts on the actual route, climb by climb, and shows how fatigue compounds over the day for you: your fitness, your abilities and the way you ride it. Connect Strava and it builds a gap analysis from your training history against the goals you have planned, so you know what still needs riding before race day.
No card. No account needed to try it, and every new account starts with 30 days of Pro. The guest demo runs the full model on the Soldier Hollow trails in Utah, with a sample season of riding behind it.
Who it's for
A race, a first big day, a comeback. If there is something on the calendar and you want to arrive ready for it, the plan is built around you: your fitness, your riding, and the route you will actually be on.
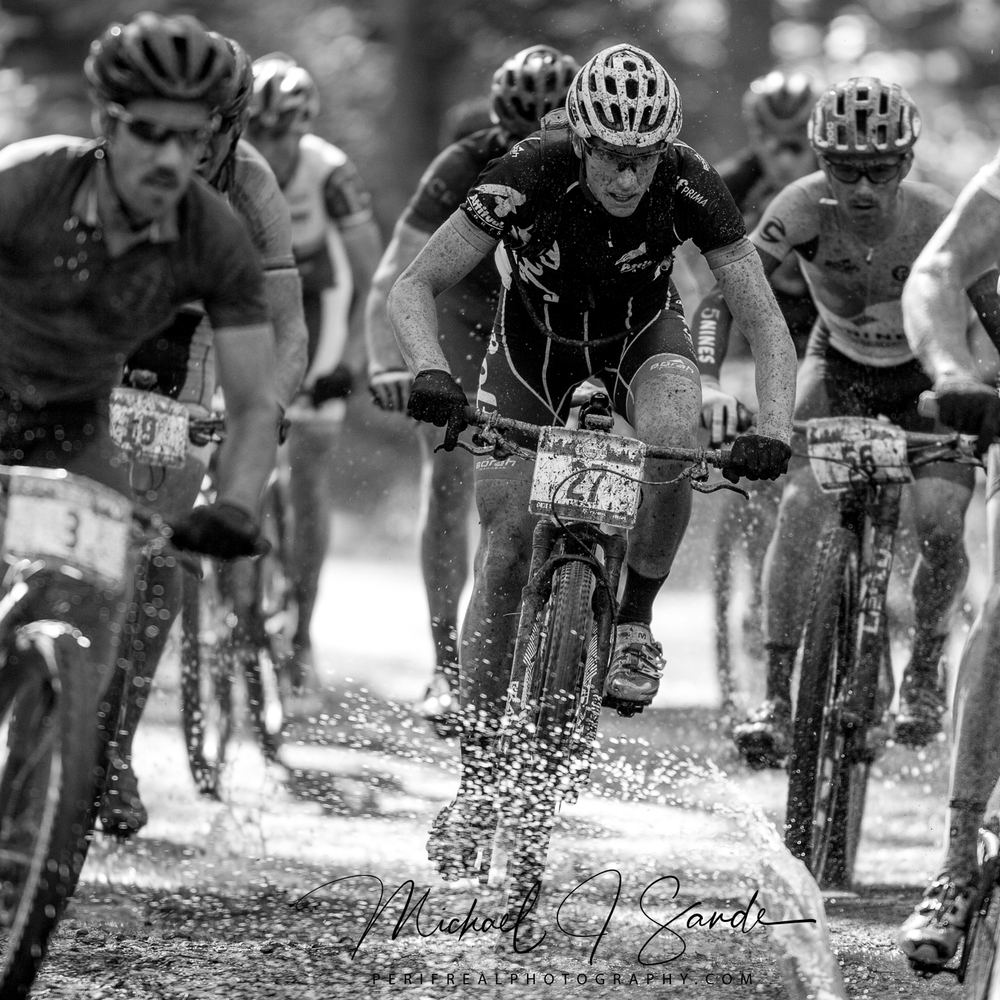
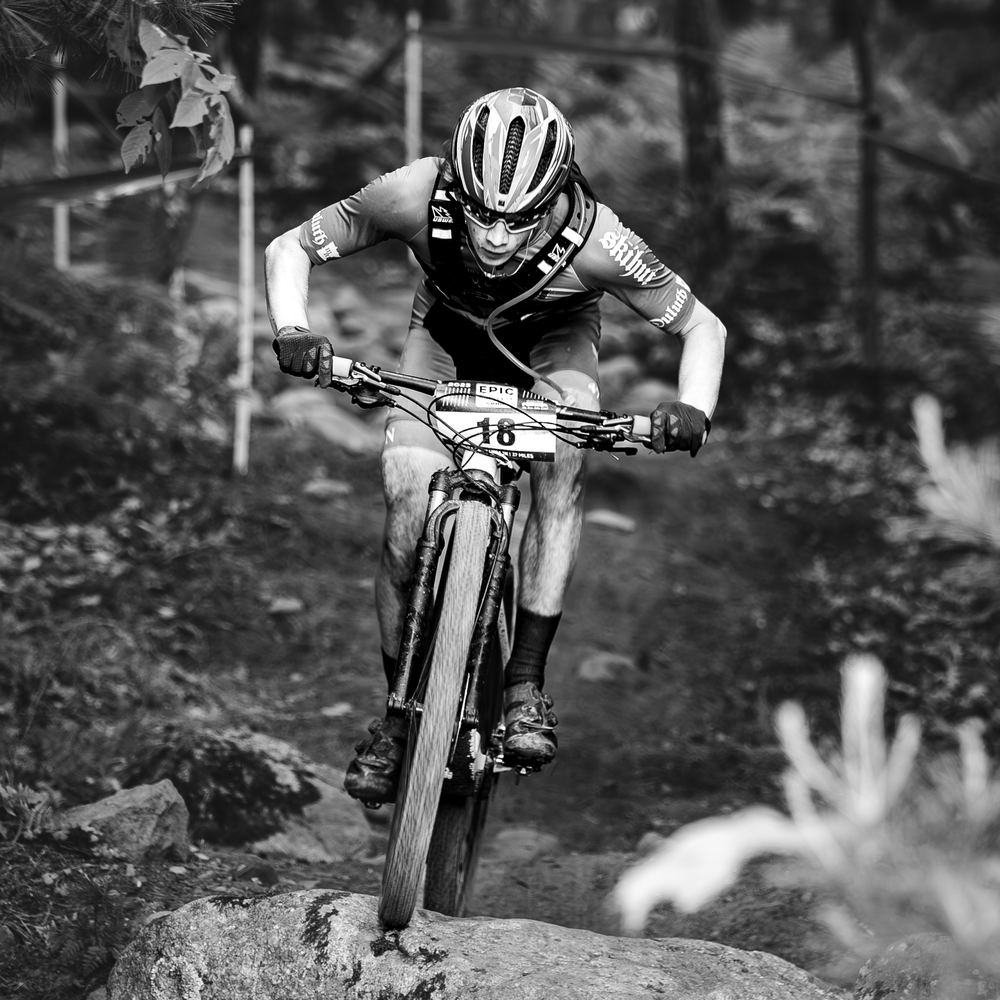
You picked a goal to get fit for, maybe the first in years. See how far off that day you are right now, what kind of riding closes the distance, and watch the gap shrink week by week on your own activities.
You already train. What you want is minutes. See which climbs and stretches hold the gap to your target time, where pacing costs you, and whether that target survives lap three.
A season of league races on courses you may only see at pre-ride. Load each venue, learn where the lap is decided, and pace short, punchy laps where your reserve above threshold runs out first. No power meter needed.
A first 50 or 100 miler, a six hour marathon, the all-day linkup. How long you are out there, when the legs start to fade, and how much to eat and carry, placed where the route actually lets you eat.
Work, family, five hours a week if it goes well. The gap analysis names the kind of riding the goal asks for that you are not doing yet, so the hours you have go to the ground that is actually costing you.
Racing somewhere you have never ridden, maybe at altitude. Ride the course before you ride the course: its climbs, its technical sections, the cost of thin air, and what recent rain has done to the trail.
Why the numbers hold up
Most ride estimates treat every mile the same. Redline models the ground you're actually on, and the bike you're riding it on.
The same bike can need twice the effort to roll on singletrack as on hardpack. Redline sets rolling resistance for every section of the route, matched from the map or set by you, and it moves your finish time more than switching bikes does.
Not watts. Redline reads the curvature of every turn and caps your speed where you would really brake, then carries the speed you leave one stretch with into the next, so a rise straight off a descent is ridden the way it really is.
Hard efforts drain a reserve that refills slowly, and the plan knows what each climb spends of it. A short race and a long day run out of different things, and the plan tracks both, so a hard lap gets a verdict built for a hard lap.
Its weight and kind set how it rolls, and your own rides on it measure how you descend, so a rigid bike's numbers never follow you onto your full suspension one. One ride you know well also tunes how much of your power the model sees reach the trail.
Built on race files from real riders on real courses, with power meters on the bike. Paced from a 90 minute race, the model predicted the same rider's 5 hour race within 6%, and the other way round. See how the model works
How it works
Set yourself up once. After that, every ride you do and every goal you add feeds the same plan.
Weight and FTP, set once. No power meter? Start from a recent hard hour and calibrate it against your own activities later. Connect Strava and your recent riding comes in on its own, cut by heart rate zone, with the ground you ride and the climbs you keep doing read straight off the files. Nothing to tag.
Drop in a GPX from a race listing, Trailforks, RideWithGPS, Strava or your head unit, or stitch several into one route. Make it a goal with a date and a target: finish it, hit a time, or beat last year. The routes you train on can be saved too, so training rides get zone pacing and race day gets race pace.
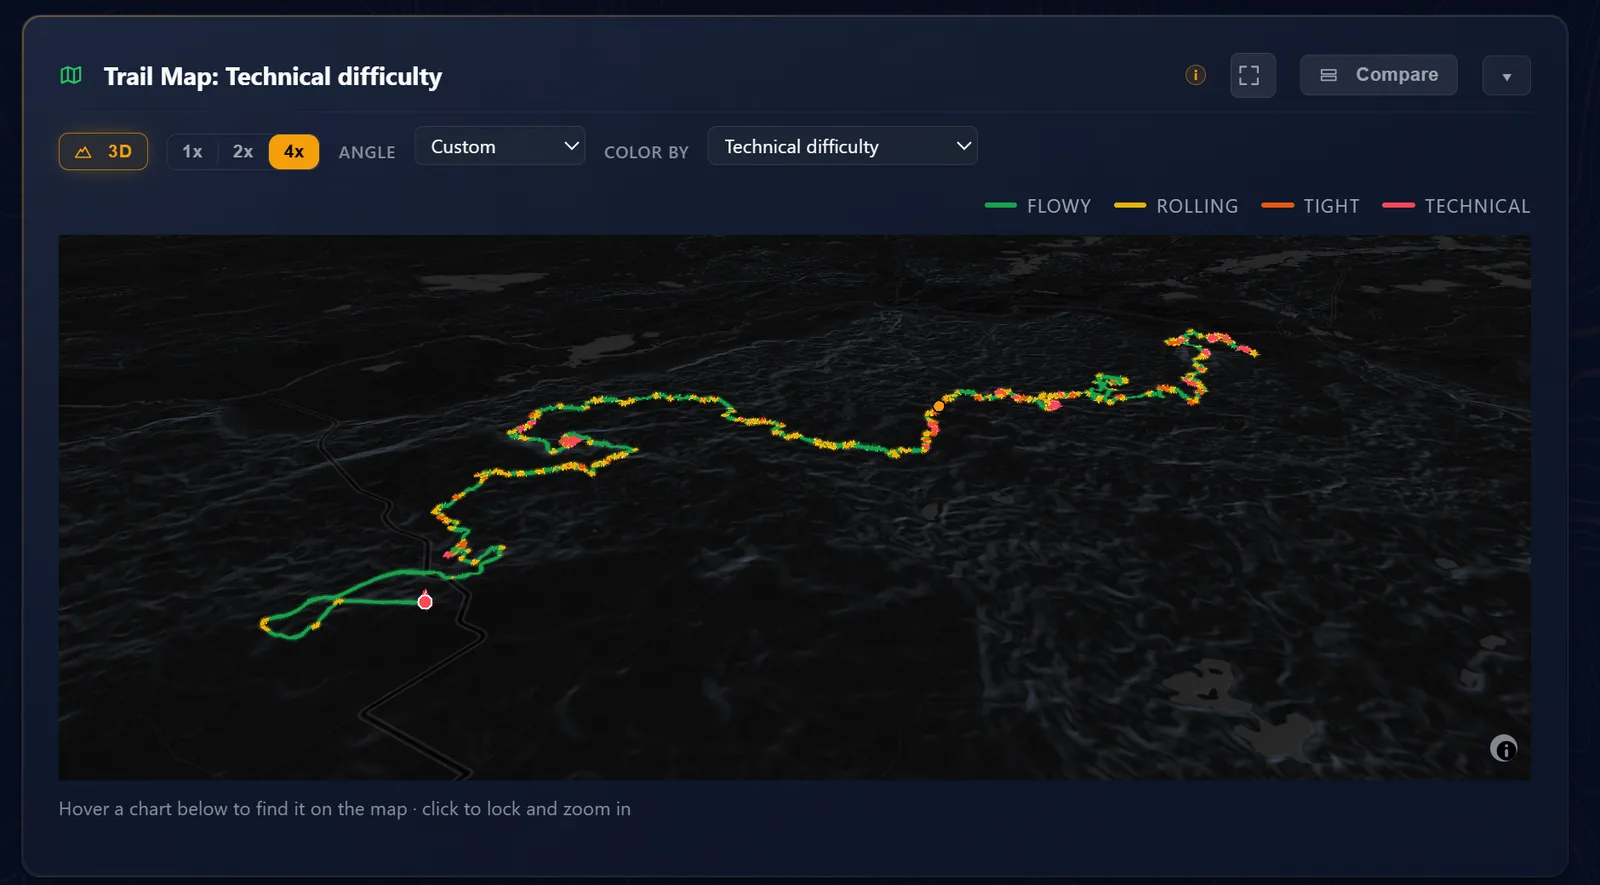
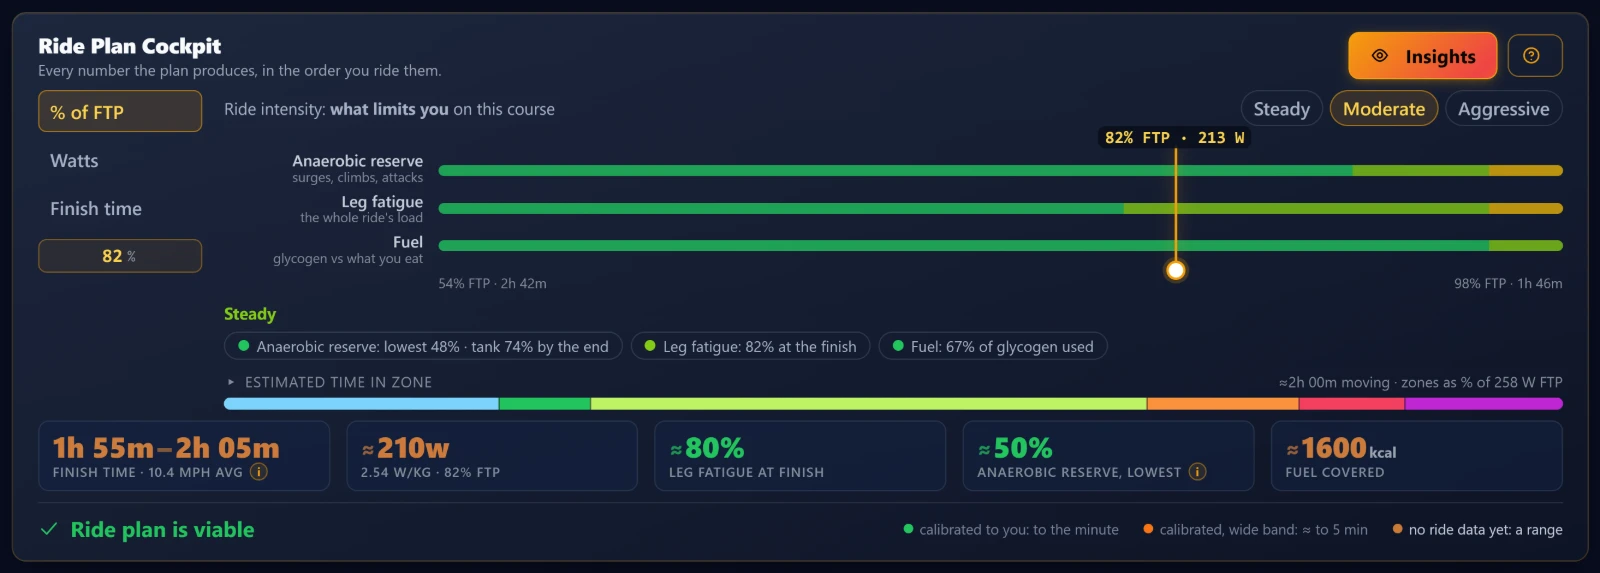
Every climb, corner and stretch of loose ground, priced by what it costs you at the moment you get there, not averaged flat. One slider sets how hard you ride. Three bars show which runs out first: your reserve above threshold, your legs, or your fuel.
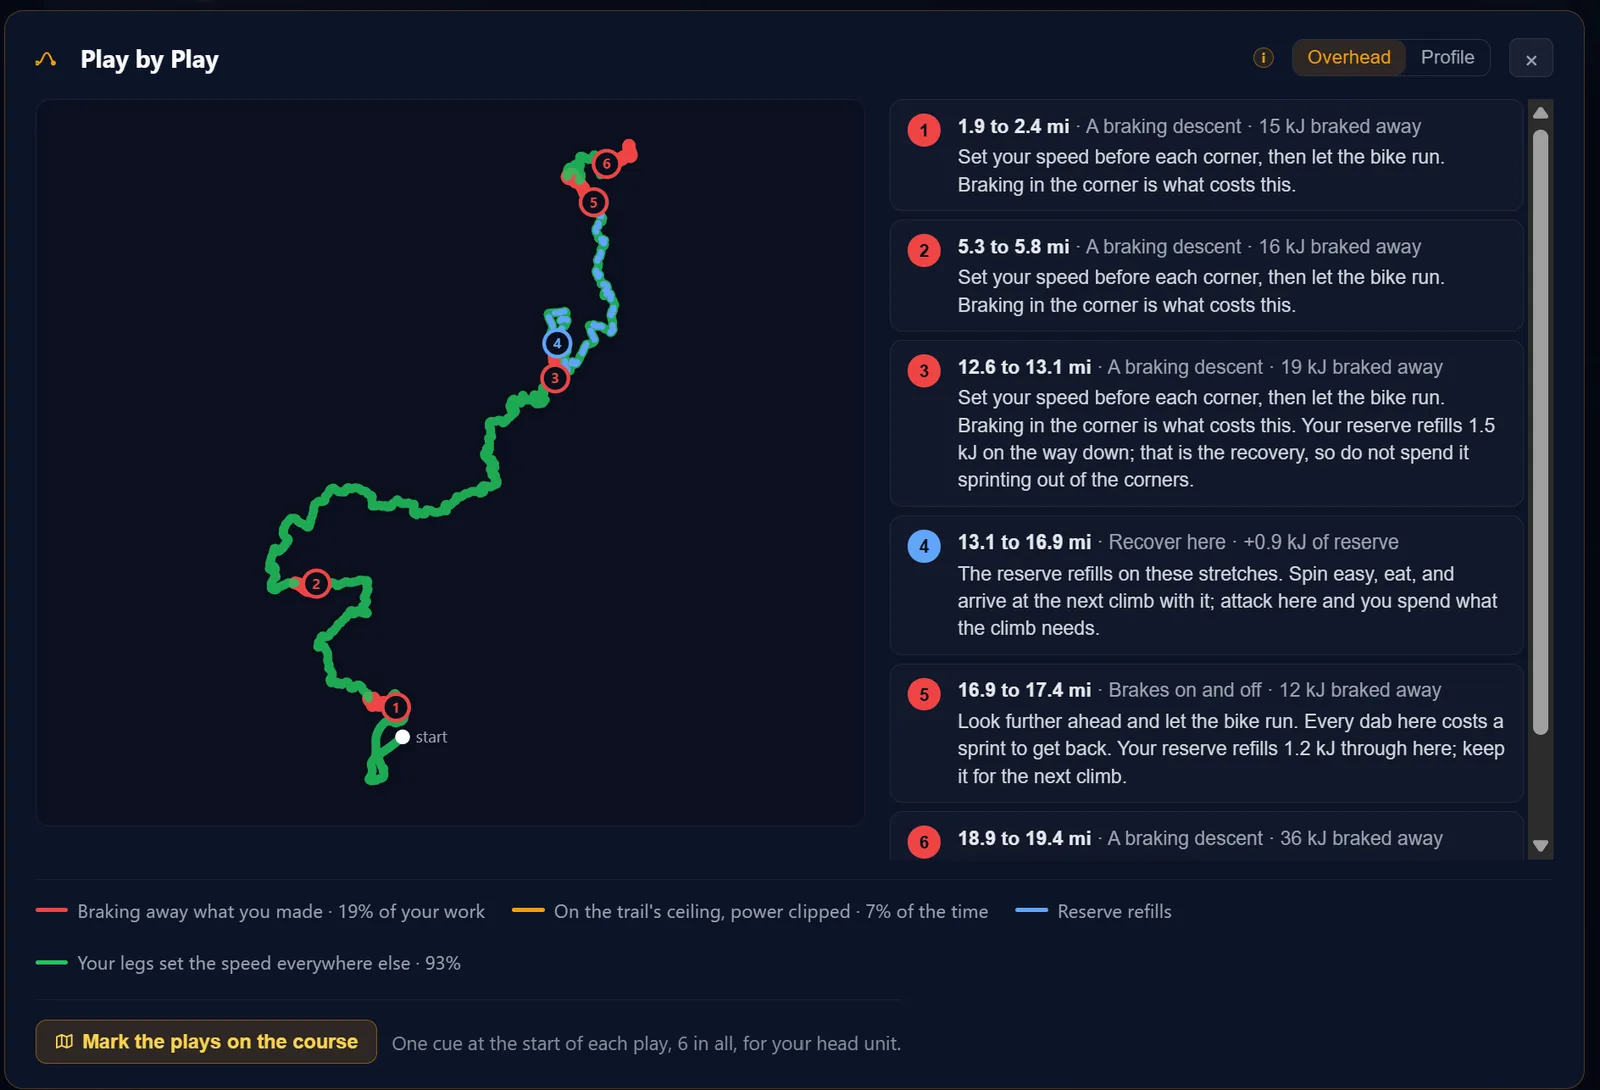
At every point on the route the model knows what set your speed: your legs, the corners, or the brakes. Every stretch where it was not your legs becomes a play, with what it throws away, what to do there, and where your reserve comes back. That is free time most riders leave on the trail.
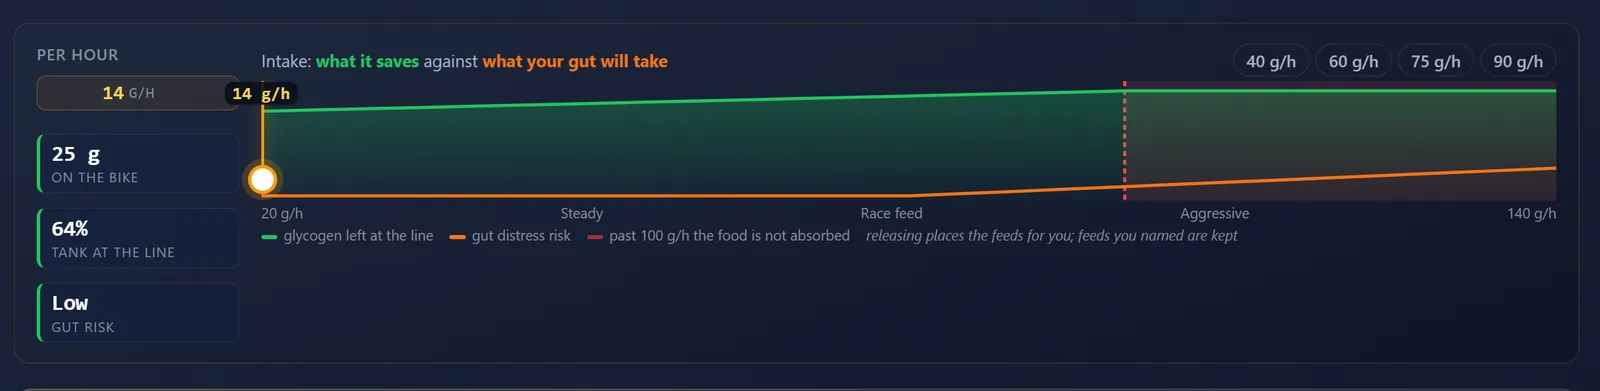
On a marathon or a 100 miler the day is decided by food as often as legs. Set carbs per hour and see what it saves in glycogen against what your gut will actually take, with feeds placed where the route lets you eat rather than on a timer.
What you get, part one
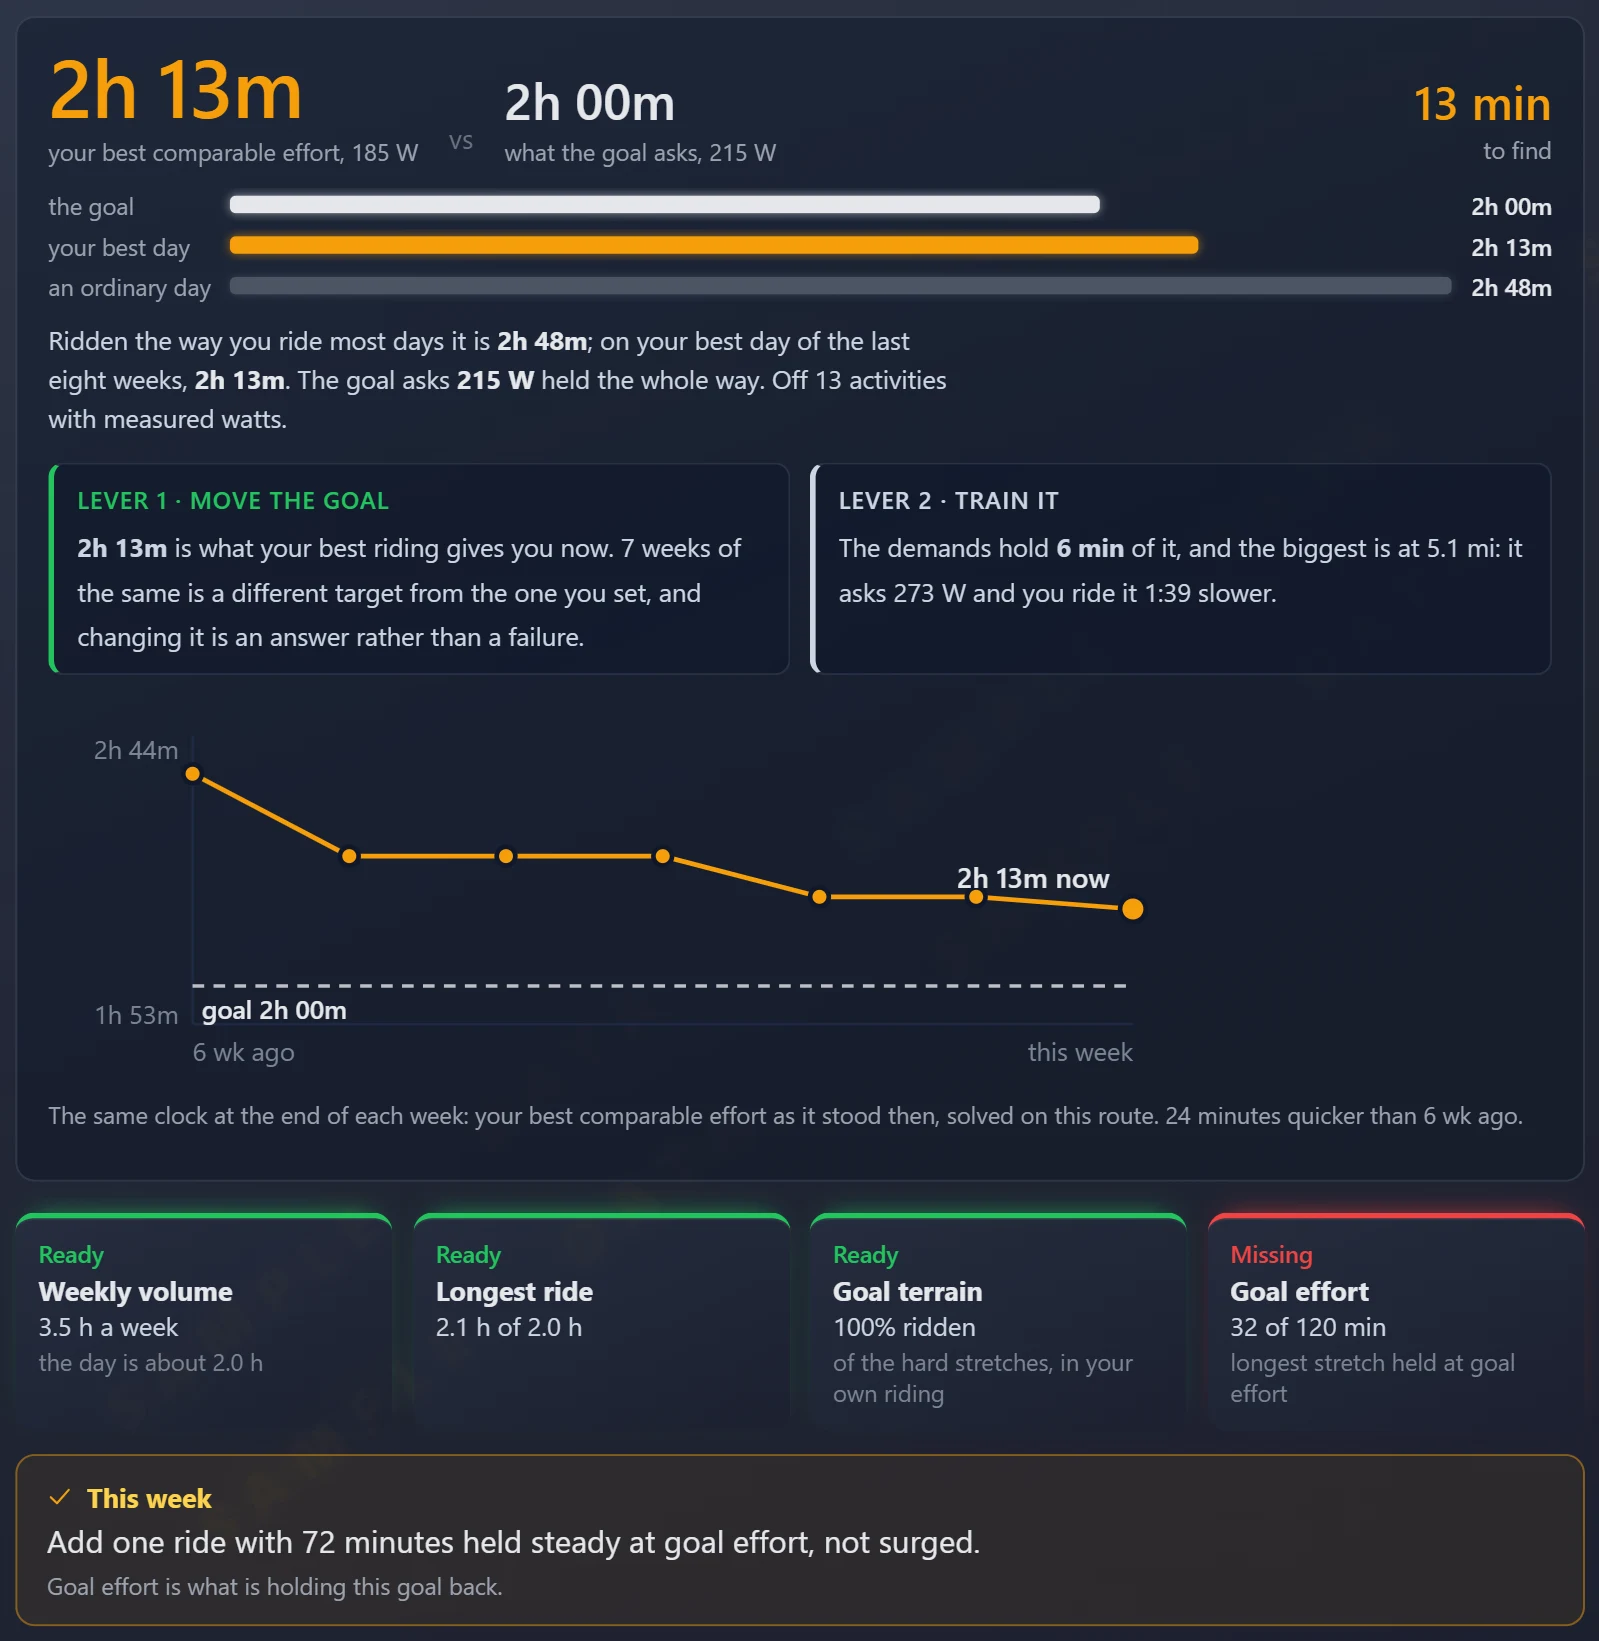
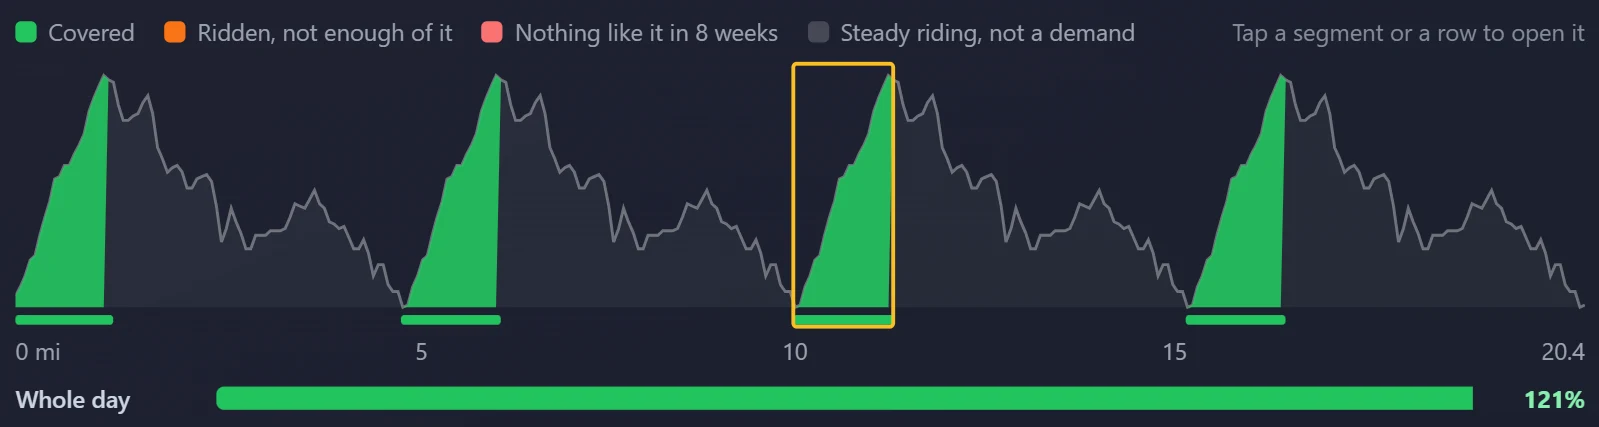
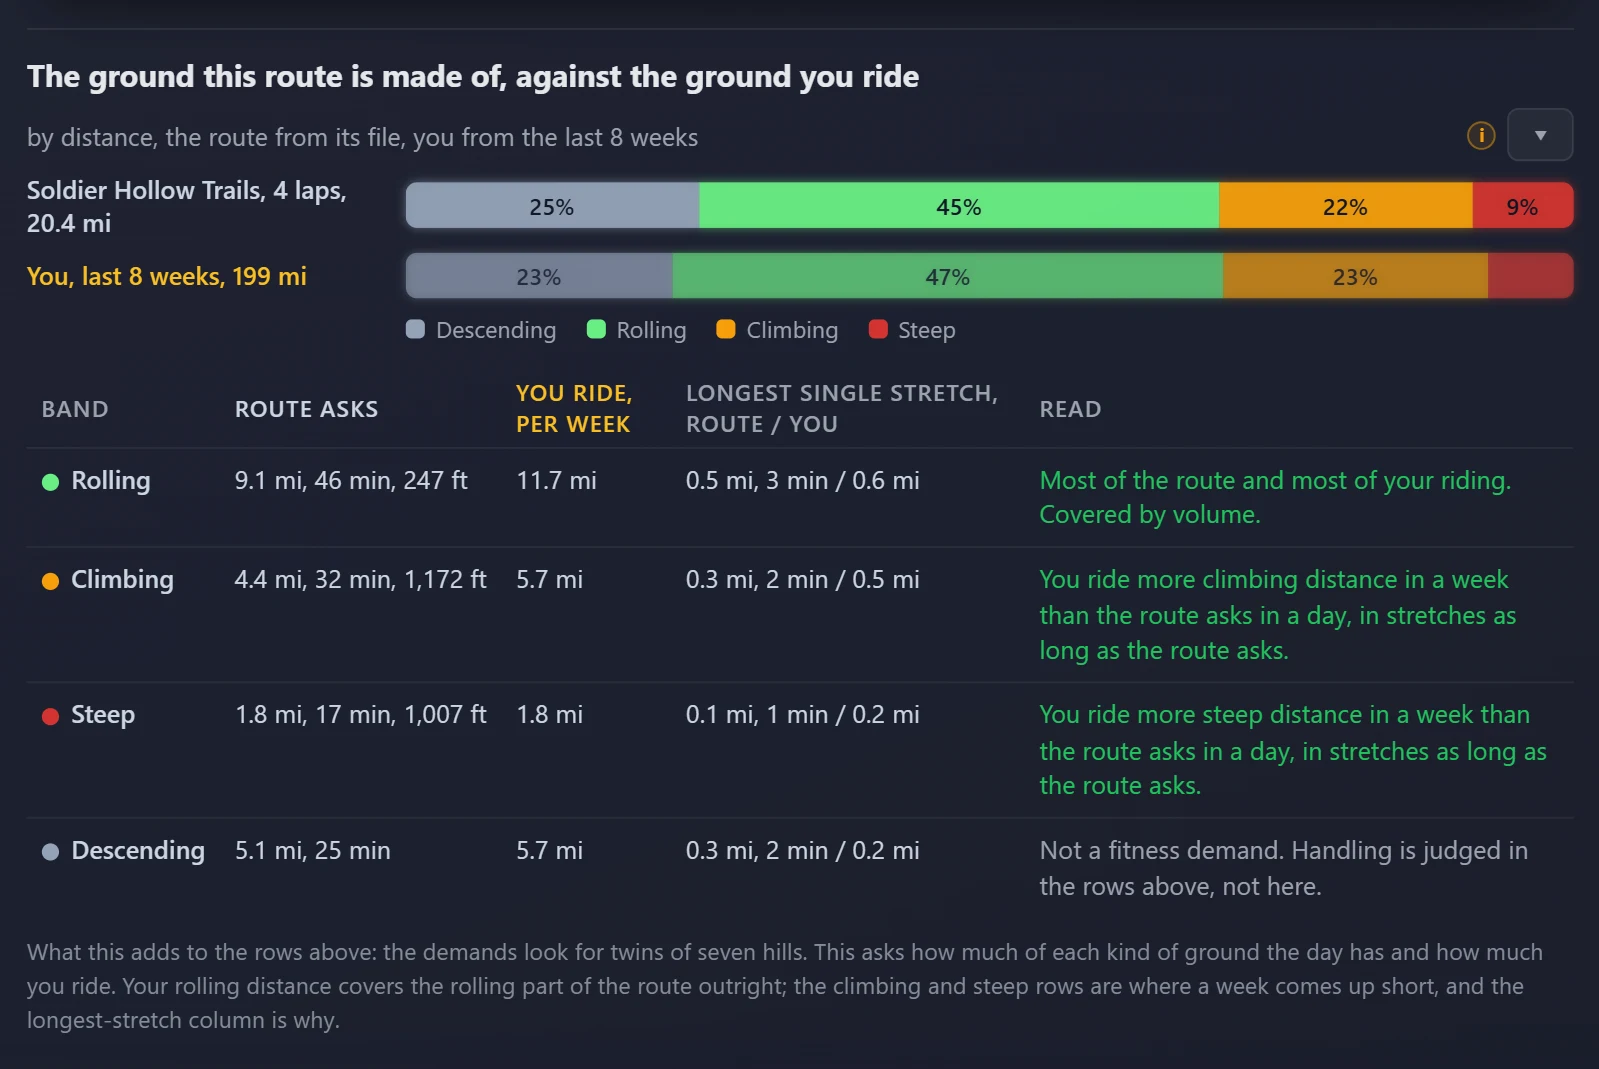
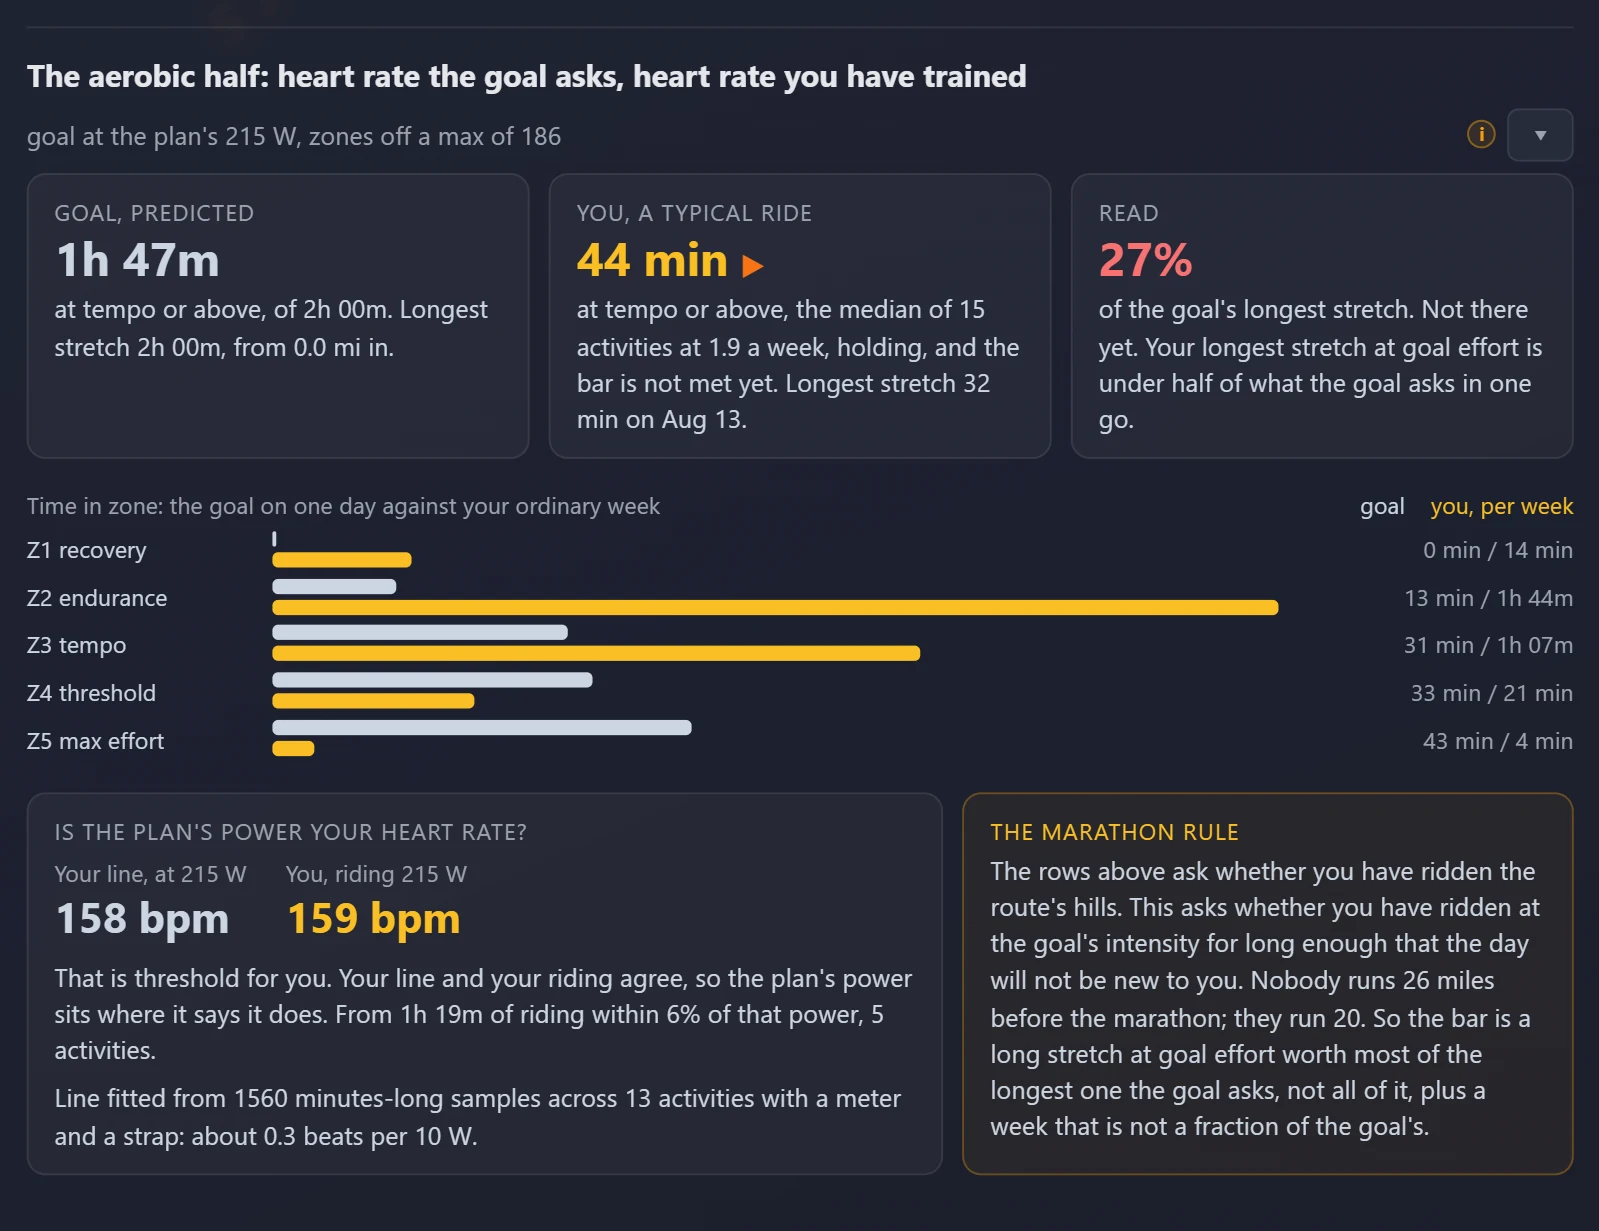
Not a fitness score. A clock. Your best comparable riding of the last eight weeks, solved over this exact route, against what your target asks, and the minutes between them. Then the two ways to close it, in the order the numbers pick: train the ground that holds the gap, or move the target.
What you get, part two
Name the stretches that decide your day and each one carries the plan's own numbers. Pick what each one shows: average speed or watts, the fatigue or reserve you arrive with, or how technical it gets. Export the route and they show up on your head unit as you reach them. Change the plan and they change with it.
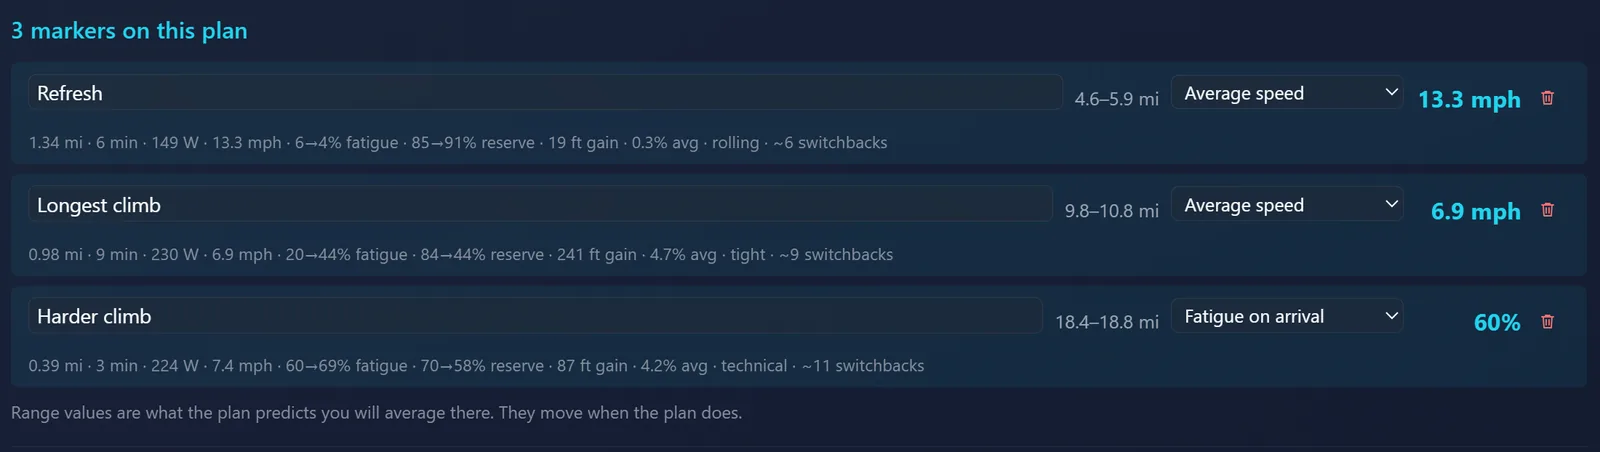
Export the TCX. Markers go in as real course points, so an Edge announces each one as you reach it.
ELEMNT ACE, BOLT 3 and ROAM 3 show them on the map from either file. Earlier BOLT and ROAM units list them in the cue sheet.
Hammerhead Karoo takes the route through Ride with GPS. Suunto and Amazfit take the route and keep points in their own apps.
What you get, part three
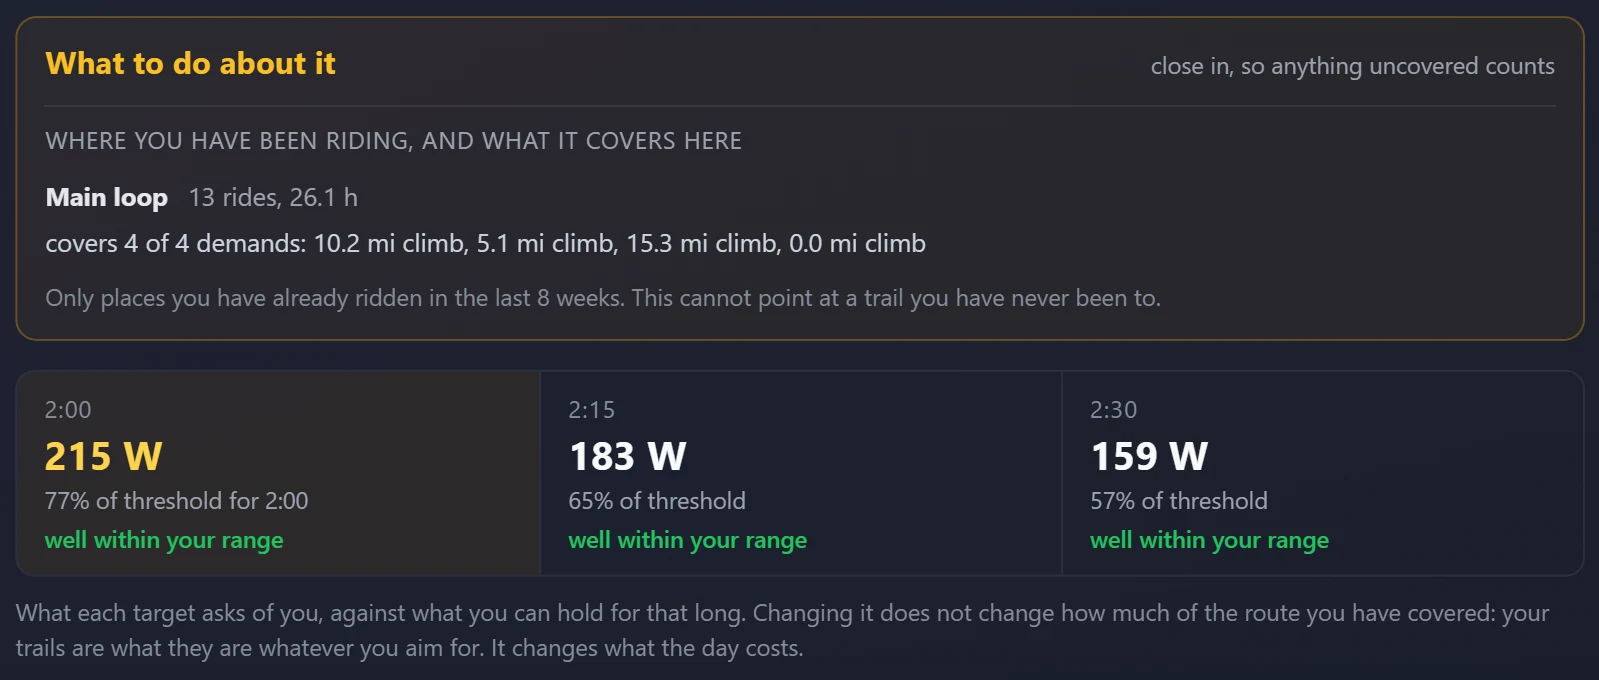
The plan does not stay on the page. Every goal on Progression hands you workouts built from its own numbers, for the trainer app you already use. On the sample goal, four laps of Soldier Hollow with a two hour target, that is:
The whole two hours at the goal’s 215 W average, each stretch at the power the plan predicts for it, in 30 steps. Warm-up and cool-down added.
The three demands that decide the day, as repeats at the watts each one asks at goal pace, with easy riding between. An hour and forty minutes.
The route itself as a FIT course, for a trainer that simulates the grade: a Garmin Edge on a smart trainer, Rouvy or FulGaz.
Workouts come as a Zwift file, an ERG file for TrainerRoad and most other trainer apps, a percent-of-FTP file, or a Garmin FIT workout. Numbers from the app’s own sample goal.
Pricing
The demo route isn't a watermarked teaser. You can run the full model on it and print the real sheet without an account.
Upload the GPX for your next goal. See what it costs, how to pace it and what to eat, then keep it saved for when you come back to it. Sign in with Google, no card, and your first 30 days are Pro.
Questions
No. Racing is where the model came from, but the same question sits behind any big day: how long will this take me, how hard can I ride it, and how much food do I need on board? Riders use it to size up a first 50-miler, an all-day linkup or an unfamiliar route just as often as a start line.
It helps, but no. The model works from your FTP and weight, and reports effort as watts per pound alongside the duration, so you can ride to feel and still trust the fueling plan. If you don't know your FTP, start from a recent hard hour and adjust.
Those model a rider holding a target on predictable surfaces. This one starts from the assumption that you can't. Technical terrain caps what's usable, and sustainable power decays across a long day. The fueling plan is scheduled against where the route lets you eat, which a road tool has no reason to consider.
Most race listings publish one. For a ride, export from Trailforks, RideWithGPS, Komoot or a Strava route, or pull it off your head unit if you've ridden part of it before.
Yes. Export the route with your markers as a GPX or a TCX course file. Use the TCX for a Garmin, because it writes the markers as real course points, which is what an Edge announces as you reach one, and the timings come from the ride the model predicts for you. A Wahoo ELEMNT ACE, BOLT 3 or ROAM 3 shows them on the map from either file, and earlier BOLT and ROAM units list them in the cue sheet. A Hammerhead Karoo takes the route but drops the markers, so route that one through Ride with GPS. Suunto and Amazfit take the route and keep points of interest in their own apps.
Yes, with Pro. Open the goal on Progression and press Training files. You get a race simulation of the whole goal at goal pace, its hardest demands as intervals, and the route as a FIT course for a trainer that simulates the grade. Workouts come as a Zwift file, an ERG file for TrainerRoad and most other trainer apps, a percent-of-FTP file, or a Garmin FIT workout.
Yes. The guest demo runs the full calculator on a loaded route with no sign-in. Uploading your own GPX and saving a profile are the parts that need an account.
Race day or the biggest ride you've attempted: run the model on a loaded route right now. No account, no card.